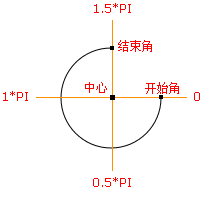
弧度 什么是弧度? 弧度是一种长度的描述单位
弧度怎么去描述? 一个弧度就是一个半径的长度
一个圆有多少个弧度 $2 * π$
一个角度等于多少弧度? 一个角度等于$ π/180$
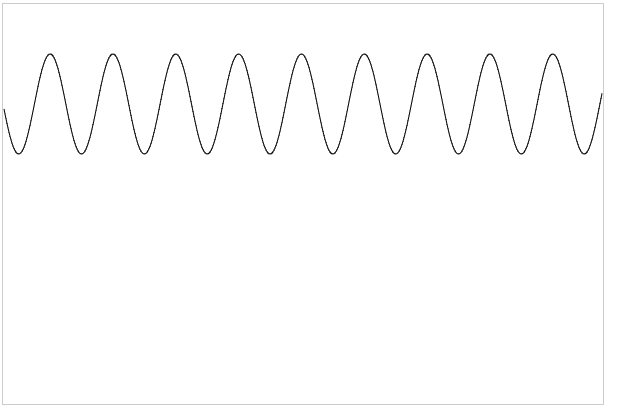
体验曲线的绘制 1.体验曲线的绘制
2.线是由点构成的
3.曲线可以由数学公式得来
<!DOCTYPE html> <html lang ="en" > <head > <meta charset ="UTF-8" > <title > Title</title > <style > canvas { border : 1px solid #ccc ; } </style > </head > <body > <canvas width ="600" height ="400" > </canvas > <script > var myCanvas = document .querySelector('canvas' ); var ctx = myCanvas.getContext('2d' ); for (var i = 1 ; i < 600 ; i ++){ var x = i; var y = 50 *Math .sin(x/10 ) + 100 ; ctx.lineTo(x,y); } ctx.stroke(); </script > </body > </html >
绘制圆弧 arc()方法 arc() 方法创建弧/曲线(用于创建圆或部分圆)。
提示: 如需通过 arc() 来创建圆,请把起始角设置为 0,结束角设置为 $2*Math.PI。$
提示: 请使用 stroke() 或 fill()方法在画布上绘制实际的弧。
context.arc(x,y,r,sAngle,eAngle,counterclockwise);
x 圆的中心的 x 坐标。
y 圆的中心的 y 坐标。
r 圆的半径。
sAngle 起始角,以弧度计。(弧的圆形的三点钟位置是 0 度)。
eAngle 结束角,以弧度计。
counterclockwise 可选。规定应该逆时针还是顺时针绘图。False = 顺时针,true = 逆时针。
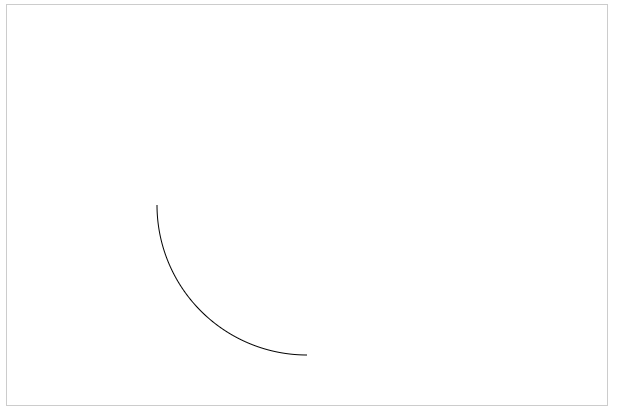
绘制四分之一弧 <!DOCTYPE html> <html lang ="en" > <head > <meta charset ="UTF-8" > <title > Title</title > <style > canvas { border : 1px solid #ccc ; } </style > </head > <body > <canvas width ="600" height ="400" > </canvas > <script > var myCanvas = document .querySelector('canvas' ); var ctx = myCanvas.getContext('2d' ); var w = ctx.canvas.width; var h = ctx.canvas.height; ctx.arc(w / 2 , h / 2 , 150 , Math .PI, Math .PI / 2 , true ) ctx.stroke(); </script > </body > </html >
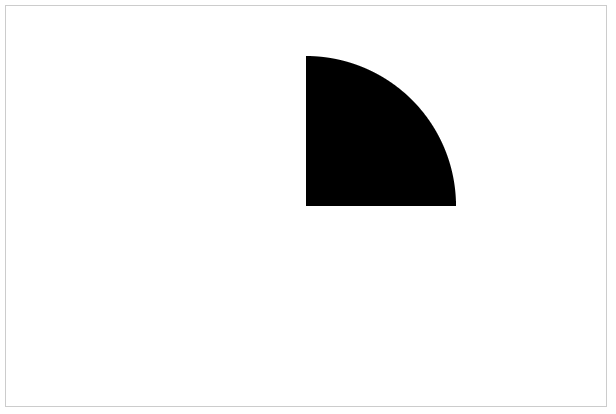
绘制扇形 绘制扇形填充得设置起点为圆心位置
<!DOCTYPE html> <html lang ="en" > <head > <meta charset ="UTF-8" > <title > Title</title > <style > canvas { border : 1px solid #ccc ; } </style > </head > <body > <canvas width ="600" height ="400" > </canvas > <script > var myCanvas = document .querySelector('canvas' ); var ctx = myCanvas.getContext('2d' ); var w = ctx.canvas.width; var h = ctx.canvas.height; ctx.moveTo(w/2,h/2); ctx.arc(w/2 ,h/2 ,150 ,0 ,-Math .PI/2 ,true ); ctx.fill(); </script > </body > </html >
绘制一个等分成n块扇形的圆 <!DOCTYPE html> <html lang ="en" > <head > <meta charset ="UTF-8" > <title > Title</title > <style > canvas { border : 1px solid #ccc ; } </style > </head > <body > <canvas width ="600" height ="400" > </canvas > <script > var myCanvas = document .querySelector('canvas' ); var ctx = myCanvas.getContext('2d' ); var w = ctx.canvas.width; var h = ctx.canvas.height; var num = 360 ; var angle = Math .PI * 2 / num; var x0 = w / 2 ; var y0 = h / 2 ; var getRandomColor = function () var r = Math .floor(Math .random() * 256 ); var g = Math .floor(Math .random() * 256 ); var b = Math .floor(Math .random() * 256 ); return 'rgb(' + r + ',' + g + ',' + b + ')' ; } for (var i = 0 ; i < num; i++) { var startAngle = i * angle var endAngle = (i + 1 ) * angle ctx.beginPath() ctx.moveTo(x0, y0) ctx.arc(x0, y0, 150, startAngle, endAngle) ctx.fillStyle = getRandomColor(); ctx.fill() } </script > </body > </html >
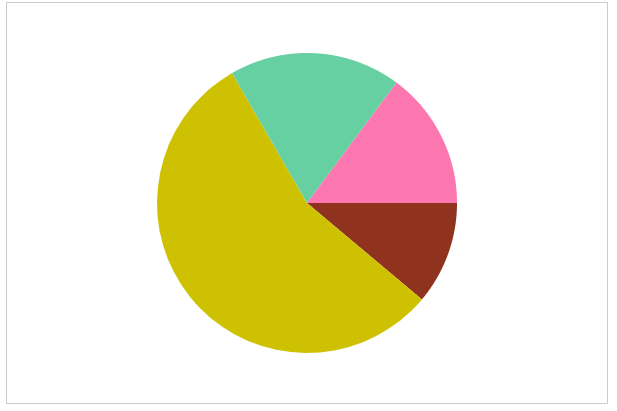
绘制饼图 通过刚才学会了绘制一个区分不同块扇形的圆,那么绘制饼图只需要简单延伸即可
<!DOCTYPE html> <html lang ="en" > <head > <meta charset ="UTF-8" > <title > Title</title > <style > canvas { border : 1px solid #ccc ; } </style > </head > <body > <canvas width ="600" height ="400" > </canvas > <script > var myCanvas = document .querySelector('canvas' ); var ctx = myCanvas.getContext('2d' ); var data = [6 , 30 , 10 , 8 ]; var angleList = []; var total = 0 ; data.forEach(function (item, i) total += item; }); console .log(total); data.forEach(function (item, i) var angle = Math .PI * 2 * (item/total); angleList.push(angle); }); console .log(angleList); var w = ctx.canvas.width; var h = ctx.canvas.height; var x0 = w/2 ; var y0 = h/2 ; var getRandomColor = function () var r = Math .floor(Math .random() * 256 ); var g = Math .floor(Math .random() * 256 ); var b = Math .floor(Math .random() * 256 ); return 'rgb(' + r + ',' + g + ',' + b + ')' ; } var startAngle = 0 ; angleList.forEach(function (item,i) var endAngle = startAngle + item; ctx.beginPath(); ctx.moveTo(x0,y0); ctx.arc(x0,y0,150,startAngle,endAngle); ctx.fillStyle = getRandomColor(); ctx.fill(); startAngle = endAngle; }); </script > </body > </html >
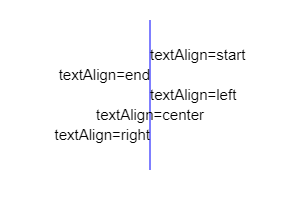
画布中心绘制文字 textAlign()方法 textAlign属性根据锚点,设置或返回文本内容的当前对齐方式。
通常,文本会从指定位置开始,不过,如果您设置为 textAlign="right" 并将文本放置到位置 150,那么会在位置 150 结束。
context.textAlign="center|end|left|right|start" ;
值
描述
start
默认。文本在指定的位置开始。
end
文本在指定的位置结束。
center
文本的中心被放置在指定的位置。
left
文本左对齐。
right
文本右对齐。
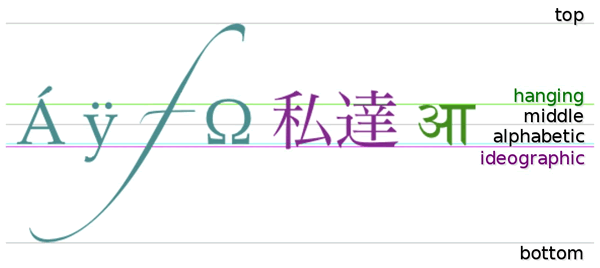
textBaseline()方法 textBaseline属性设置或返回在绘制文本时的当前文本基线。
context.textBaseline="alphabetic|top|hanging|middle|ideographic|bottom" ;
值
描述
alphabetic
默认。文本基线是普通的字母基线。
top
文本基线是 em 方框的顶端。。
hanging
文本基线是悬挂基线。
middle
文本基线是 em 方框的正中。
ideographic
文本基线是表意基线。
bottom
文本基线是 em 方框的底端。
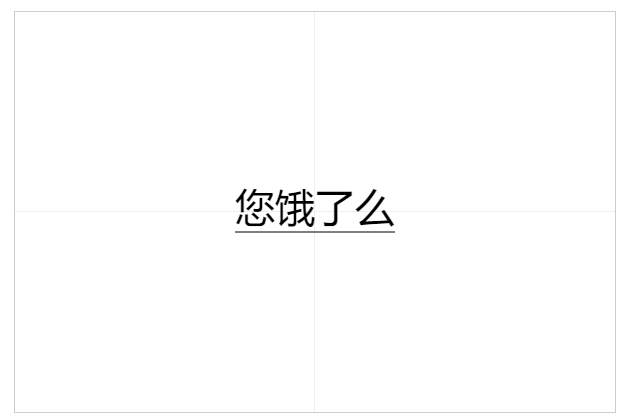
<!DOCTYPE html> <html lang ="en" > <head > <meta charset ="UTF-8" > <title > Title</title > <style > canvas { border : 1px solid #ccc ; display: block; margin: 100px auto; } </style > </head > <body > <canvas width ="600" height ="400" > </canvas > <script > var myCanvas = document .querySelector('canvas' ); var ctx = myCanvas.getContext('2d' ); var str = '您饿了么' ; var w = ctx.canvas.width; var h = ctx.canvas.height; ctx.beginPath(); ctx.moveTo(0, h / 2 - 0.5); ctx.lineTo(w, h / 2 - 0.5); ctx.moveTo(w / 2 - 0.5, 0); ctx.lineTo(w / 2 - 0.5, h); ctx.strokeStyle = '#eee' ; ctx.stroke(); ctx.beginPath(); ctx.strokeStyle = '#000' ; var x0 = w / 2 ; var y0 = h / 2 ; ctx.font = '40px Microsoft YaHei' ; /*左右对齐方式 (center left right start end ) 基准起始坐标*/ ctx.textAlign = 'center' ; ctx.textBaseline = 'middle' ; ctx.fillText(str, x0, y0); ctx.beginPath(); var width = ctx.measureText(str).width; ctx.moveTo(x0 - width / 2, y0 + 20); ctx.lineTo(x0 + width / 2, y0 + 20); ctx.stroke(); </script > </body > </html >
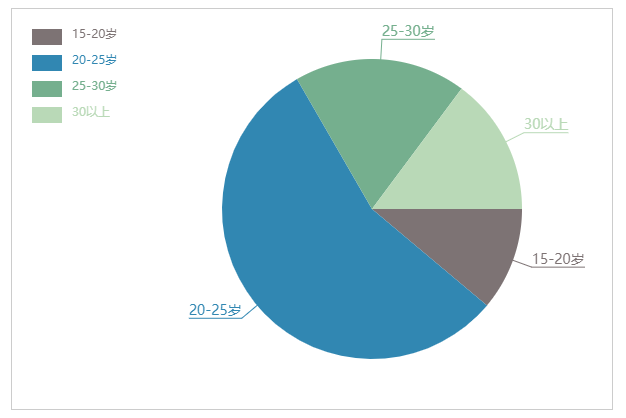
绘制完整饼状图表 <!DOCTYPE html> <html lang ="en" > <head > <meta charset ="UTF-8" > <title > Title</title > <style > canvas { border : 1px solid #ccc ; display: block; margin: 100px auto; } </style > </head > <body > <canvas width ="600" height ="400" > </canvas > <script > /*var myCanvas = document.querySelector('canvas'); var ctx = myCanvas.getContext('2d' );*/ var PieChart = function (ctx) this .ctx = ctx || document .querySelector('canvas' ).getContext('2d' ); this .w = this .ctx.canvas.width; this .h = this .ctx.canvas.height; this .x0 = this .w / 2 + 60 ; this .y0 = this .h / 2 ; this .radius = 150 ; this .outLine = 20 ; this .rectW = 30 ; this .rectH = 16 ; this .space = 20 ; } PieChart.prototype.init = function (data) this .drawPie(data); }; PieChart.prototype.drawPie = function (data) var that = this ; var angleList = this .transformAngle(data); var startAngle = 0 ; angleList.forEach(function (item, i) var endAngle = startAngle + item.angle; that.ctx.beginPath(); that.ctx.moveTo(that.x0, that.y0); that.ctx.arc(that.x0, that.y0, that.radius, startAngle, endAngle); var color = that.ctx.fillStyle = that.getRandomColor(); that.ctx.fill(); that.drawTitle(startAngle, item.angle, color , item.title); that.drawDesc(i,item.title); startAngle = endAngle; }); }; PieChart.prototype.drawTitle = function (startAngle, angle ,color , title) var edge = this .radius + this .outLine; var edgeX = Math .cos(startAngle + angle / 2 ) * edge; var edgeY = Math .sin(startAngle + angle / 2 ) * edge; var outX = this .x0 + edgeX; var outY = this .y0 + edgeY; this .ctx.beginPath(); this .ctx.moveTo(this .x0, this .y0); this .ctx.lineTo(outX, outY); this .ctx.strokeStyle = color; this .ctx.font = '14px Microsoft YaHei' ; var textWidth = this .ctx.measureText(title).width ; if (outX > this .x0){ this .ctx.lineTo(outX + textWidth,outY); this .ctx.textAlign = 'left' ; }else { this .ctx.lineTo(outX - textWidth,outY); this .ctx.textAlign = 'right' ; } this .ctx.stroke(); this .ctx.textBaseline = 'bottom' ; this .ctx.fillText(title,outX,outY); }; PieChart.prototype.drawDesc = function (index,title) this .ctx.fillRect(this .space,this .space + index * (this .rectH + 10 ),this .rectW,this .rectH); this .ctx.beginPath(); this .ctx.textAlign = 'left' ; this .ctx.textBaseline = 'top' ; this .ctx.font = '12px Microsoft YaHei' ; this .ctx.fillText(title,this .space + this .rectW + 10 , this .space + index * (this .rectH + 10 )); }; PieChart.prototype.transformAngle = function (data) var total = 0 ; data.forEach(function (item, i) total += item.num; }); data.forEach(function (item, i) var angle = item.num / total * Math .PI * 2 ; item.angle = angle; }); return data; }; PieChart.prototype.getRandomColor = function () var r = Math .floor(Math .random() * 256 ); var g = Math .floor(Math .random() * 256 ); var b = Math .floor(Math .random() * 256 ); return 'rgb(' + r + ',' + g + ',' + b + ')' ; }; var data = [ { title: '15-20岁' , num: 6 }, { title: '20-25岁' , num: 30 }, { title: '25-30岁' , num: 10 }, { title: '30以上' , num: 8 } ]; var pieChart = new PieChart(); pieChart.init(data); </script > </body > </html >
